Out of sight, out of mind
— visualizing the unseen / forgotten / invisible
by Cagatay Turkay
Data visualisations are lenses that we see data through, devices through which we make meaning of data and the phenomena they relate to. They depict data visually in one form or the other, sometimes as static charts, sometimes as interactive digital mediums that we can engage with. They are ubiquitous now in our smart cities — we come across them as maps and charts that tell us stories about the places we live, help us consider data in different forms of planning in our everyday lives, and they are put to use as “efficient mediums” that distil large volumes of information for decision-makers to reach decisions on the future of our cities. Visualisations are often perceived as complete, objective representations of data and the reality that the data relates. But how can visualisations be complete, when the perspectives one could surface are missing from the data, or even worse, when there is no data to begin with? Can the role of visualisation be to visualise the missing, what is not seen, left out?
One of MoTH project’s starting points was to point at the missing more-than-human-perspectives in our understanding of the urban and the data that are missing that can operationalise such perspectives. In her work, Mimi Onuoha talks about “missing datasets”, which she describes as “blank holes in otherwise data-saturated systems” — holes most often relating to the most vulnerable in our society, and holes that should be filled, but not yet — for one reason or the other. One realisation that emerged from the discussions at the workshops was how much we are missing in our data systems — many species and many intertwined mechanisms between multiple species happening around us are under-represented, unseen, forgotten, and thus “unvisualised”. What would it mean to be able to see the routes that the urban foxes are taking during the night, the microbial populations in different city parks, the number of spider homes on our street, along with the data that we generate and collect about our own presence in cities, would we plan our actions differently, make decisions differently?
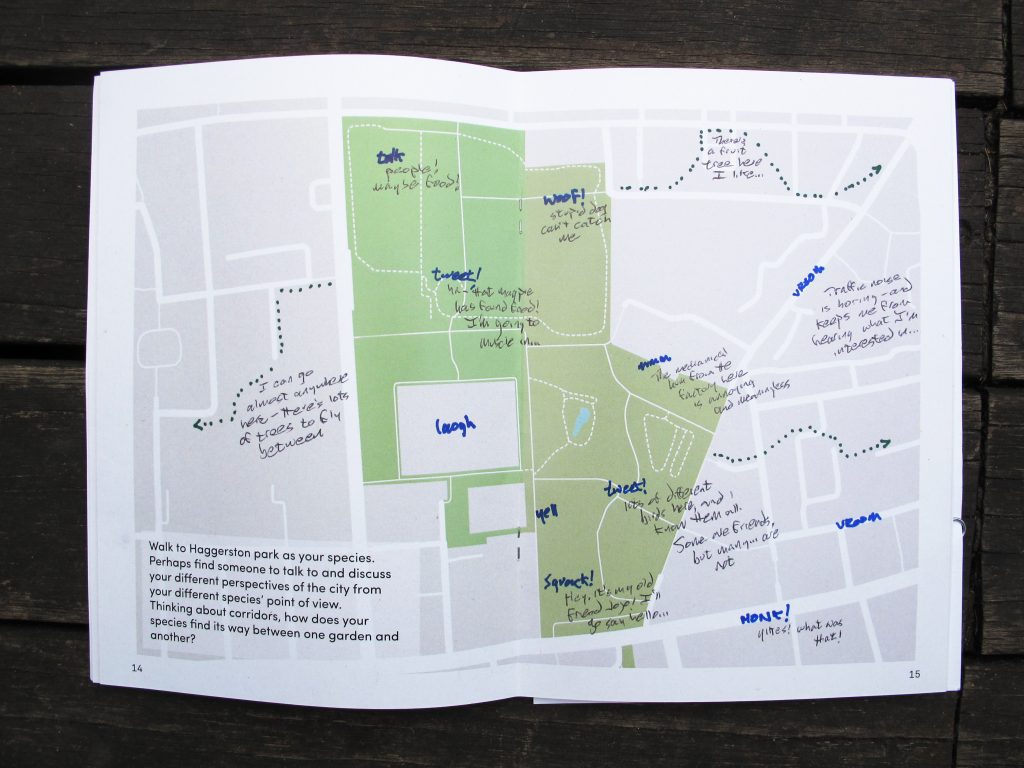
Reflecting on how we understand and gather data in our urban data systems is a good first step. Citizen science projects across the UK and the world where members of the public gather records of various species — birds, butterflies, moths and bats are some of the first few that come to mind — have contributed tremendously to biodiversity and conservation projects, and have shown the power of these approaches. But, how do we expand on these experiences to various other unseen species, how do we innovate in our methods of data collection? Through playful role-playing methods and data walks, the workshops have shown us fresh perspectives in how we can look differently to our surroundings, use these perspectives to generate unconventional forms of data and pushing us to find ways of putting different species “on the map”. The species-perspective-maps emerging from the workshops are exciting examples of how different forms of data can take shape — what a parakeet might be thinking at different parts of a park, what a cabbage-white butterfly might find useful, dangerous, or interesting to explore. Such data might not always be collected for modelling, for running systems more efficiently, but could be collected to reflect, create a dialogue, to become aware — a form of “slow data” — in a similar vein to how Giorgia Lupi and Stefanie Posavec refer to their hand drawn data sketches in their Dear Data project.
Gathering and making such data available is a crucial first step, and then comes transforming and making that data visible and understood in ways that we can comprehend, discuss about, and reflect on. This is where visualisations can come into play, but there are some interesting challenges. Much of the activity in and around us are happening at various different scales without us noticing or unable to comprehend, so the data will reflect that framing. These can be scales that are not visible to the human eye, or scales not easily relatable to the human mind. For instance, how can we understand a 5mm journey of a soil nematode in a planter on our street, and how does that translate to our morning commute? Another such scale is time — how can we appreciate processes that happen in different temporalities? How do we see the mechanisms at play on a decaying piece of wood, which species consume which parts and at what speeds? How do we build bridges between how we and different species experience time, bringing us closer to understanding them?
These questions emerging from this project are fascinating to reflect on as a visualisation researcher. What are some visual lenses that can show us stories at different scales, similar to a microscope, but helping us see data at multiple scales while revealing the complex relations between them. How to design data narratives that relate, for instance, the fast-moving people of cities with the slow-moving processes of other species, in ways where both are valued and related? How can visualisation be a medium of interaction and communication between us and such unseen, forgotten, and invisible species and mechanisms in the urban, so that we can recognise, appreciate, and understand them, and build on these reflections to find better ways of cohabiting the urban spaces?
Helene Schulze’s piece — that is also in this booklet — reflecting on her interactions with the Council on the Forest Garden planters is a vivid example of why we should do more to make multiple species visible and give these perspectives a voice in discussions that shape how urban spaces are transformed. It is essential, and also exciting, to explore further how we can broaden our understandings of data to make our urban data systems inclusive and agile to accommodate multi-species-perspectives; to further develop innovate ways of recording that encourage us to look differently to our surroundings; and to find new ways of seeing (data) that can help unravel the intertwined, multi-scalar, and multi-temporal multi-species relations happening around us. These questions and the discussions above are all framed from a human meaning-making perspective — so possibly the more important question that we need to ask is: how do we extend the meaning of “us” in these questions to other species, what would that mean to think not only about data and visualisations “of” but “for”, and even “with” other species? We don’t have the answers to these challenges yet but we have some very good questions to begin with.